
Calculating ad impressions sounds simple: it’s the total number of times your ad is displayed to a user. But in a world without cookies, where every dollar of ad spend is scrutinized, treating impressions as just a "view count" is a surefire way to misjudge campaign performance. This metric is the foundational layer for every digital advertising campaign, from social media to the new frontier of in-store retail media.

Before diving into formulas, let's establish why impressions are the bedrock of any robust advertising strategy.
Marketers often overlook that impressions are key to understanding brand visibility and market reach, beyond just "views." They mark the initial customer interaction, crucial for:
Budgeting and Media Planning: Offering a measure for ad space purchases.
Gauging Market Reach: Indicating the extent of audience connection.
Performance Benchmarking: Serving as a basis for KPIs like Cost Per Mille (CPM), essential for comparing advertising channels.
Let's break down the key terms you’ll need to master.
This table is your quick-reference guide. Understanding these terms is the first step to using impression data strategically, whether you're a CPG brand or a media buyer.
Getting these definitions straight puts the numbers in context. Now, let’s turn those numbers into strategy.
Calculating impressions involves counting how often an ad is fetched and displayed on platforms like websites, apps, or in-store screens. CPG brands and retailers use Cost Per Mille (CPM)—cost per thousand impressions—for budgeting and performance assessment.
This metric links spending to exposure, offering clear insight into a campaign's reach on platforms such as Google, Meta, and in-store networks like Kroger Precision Marketing. For example, reporting 500,000 impressions highlights brand presence more effectively than just tracking "clicks."
Impressions are the currency of brand awareness. While clicks measure action, impressions measure opportunity—the chance to make a lasting impact on a potential customer long before they add an item to their cart.
A large impression count isn't the goal; it's a starting point for analysis. Low click-through rates despite many impressions may indicate issues with ad creative or targeting. Conversely, fewer impressions with high conversions might suggest an effective niche. This understanding is key to modern marketing and data-driven decision-making. You can learn more about how https://www.intouch.com/live/resources/how-intouch-com-is-shaping-modern-marketing.
For a deeper dive, explore these strategies to improve marketing ROI by looking beyond superficial metrics like impressions. By mastering this foundational metric, you can build campaigns that don't just reach audiences but resonate with them.
Let's transition from theory to the formulas for calculating impressions. Start by summing your total impressions over a period to quickly assess your campaign's visibility.
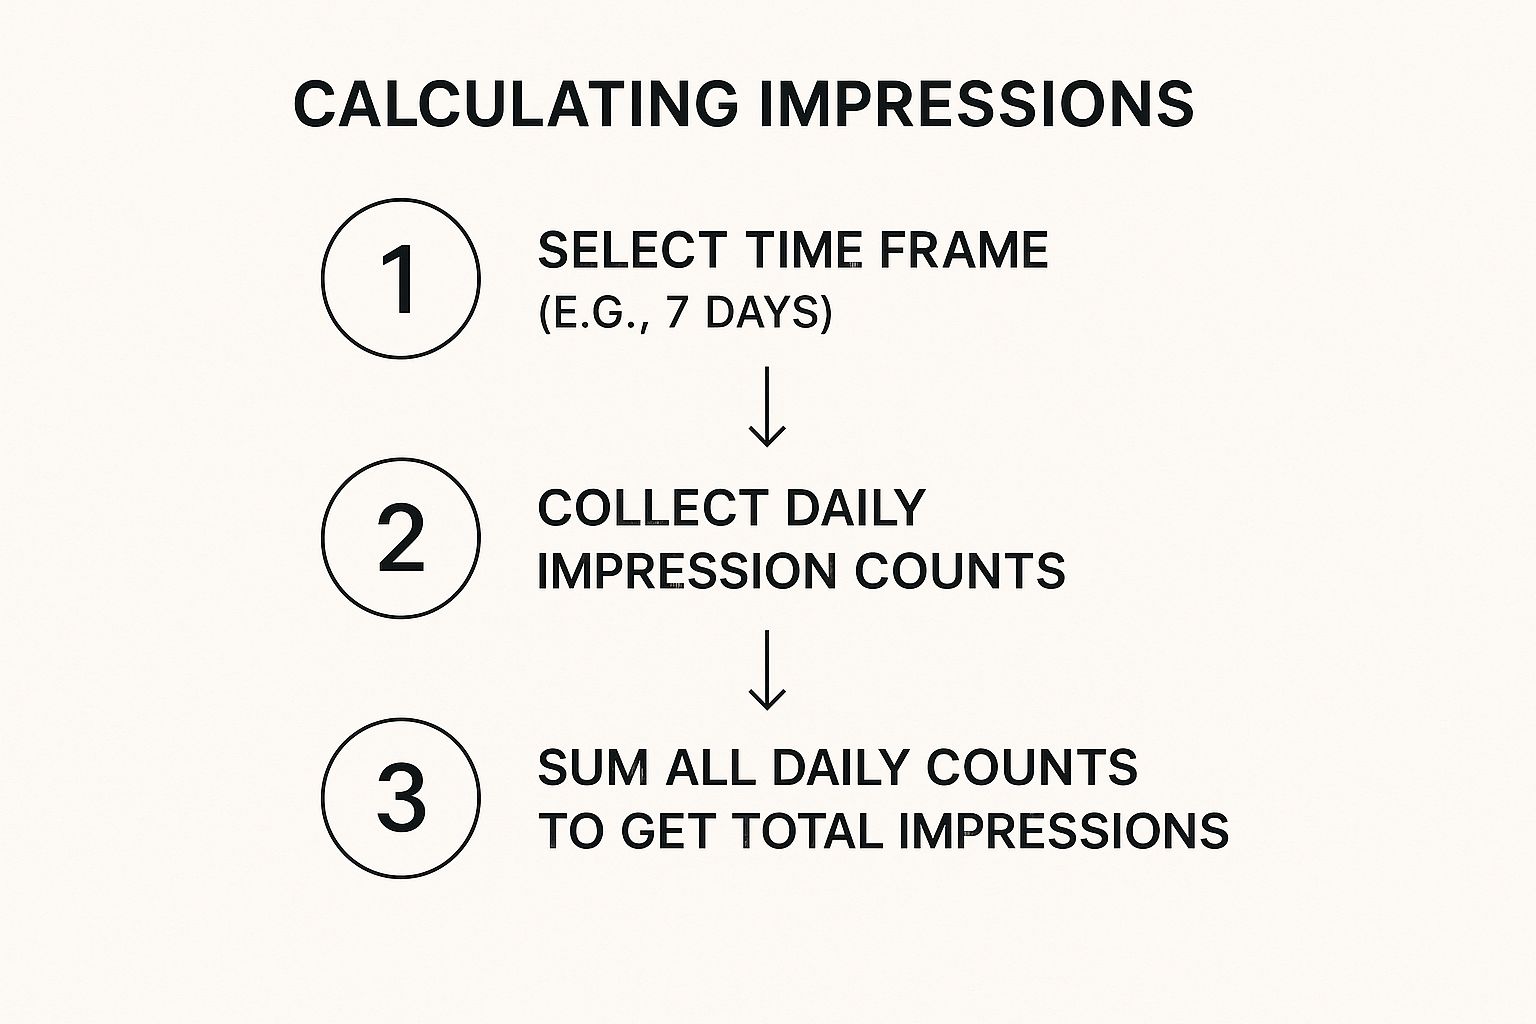
Choose a time frame, collect the data, and sum it up. This shows what happened, while the formulas explain the so what?
Cost Per Mille, or CPM, is the industry-standard metric for determining the cost-efficiency of your ad placements. It tells you exactly how much you’re paying for every 1,000 impressions.
The formula is simple:
CPM = (Total Campaign Cost / Total Impressions) x 1,000
Let's use a real-world example. Imagine a CPG brand like Unilever runs a campaign on in-store digital screens with a $5,000 budget. At the end of the campaign, they generated 250,000 impressions.
Plugging those numbers into the formula:
CPM = ($5,000 / 250,000) x 1,000
CPM = $0.02 x 1,000
CPM = $20
This means Unilever paid $20 for every thousand times its ad was displayed to shoppers. This is a crucial figure for comparing different channels—for instance, evaluating in-store media against direct mail campaigns, like those offered through Intouch Ads USPS solutions. A good CPM for a highly targeted B2B campaign on LinkedIn will be drastically different from a broad awareness campaign on TikTok.
Not all impressions are equal, and distinguishing between served and viewable impressions is crucial for accurate analysis.
Served Impressions: Counts every time an ad is sent but doesn't ensure it was seen, as it might be below the fold or load slowly.
Viewable Impressions: Only counts when a certain percentage of the ad is visible on the screen for a set time.
Modern ad platforms focus on viewable impressions for a more realistic measure of ad visibility. Check your platform's default metric, as relying solely on served impressions may inflate performance.
nce numbers and lead to wasted ad spend on placements no one actually sees.

Each ad platform has unique dashboard and reporting features for impressions. This guide helps you understand impression data across various ad ecosystems.
For many advertisers, Google Ads is ground zero.You can monitor impression data at the campaign, ad group, and keyword levels. Go to the "Campaigns" tab and ensure the "Impressions" column is visible.
Don't just focus on the numbers. Pay attention to:
Impression Share (IS): This shows the percentage of impressions your ads received versus those they could have. A low IS may indicate a small budget or low ad rank.
Search vs. Display Network: Google divides impressions between the Search Network (text ads) and the Display Network (banner ads). Analyze their performance separately as they differ significantly in cost and user intent.
Meta's Ads Manager is the hub for Facebook and Instagram. It's critical to segment your reporting to see what each platform delivers. Use the "Breakdown" menu to see how impressions differ by:
Placement: An impression in Instagram Stories is a different beast than one in the Facebook Feed. Analyze which placements give you the most cost-effective visibility.
Device: Are you reaching more people on mobile or desktop? This should directly inform your creative strategy.
Platform: Compare Facebook, Instagram, Messenger, and the Audience Network to see where your budget is pulling its weight.
An impression on Meta isn't just a number; it's a signal of potential visibility in a crowded social feed. Your job is to find the placements that deliver quality impressions—the ones most likely to actually be seen by the right people.
LinkedIn and TikTok serve different audiences, and their impression data reflects that. In LinkedIn Campaign Manager, Impressions are crucial for brand awareness campaigns aimed at professionals, especially in a B2B context. Focus on demographics to target the right job titles and industries.
On TikTok's Ad Manager, An impression is temporary. Focus on view-through rates and early engagement to measure impact. Due to the platform's dynamic nature, monitor frequency to prevent audience fatigue.
Impression value differs across platforms. When CPM rates drop, as seen with X (formerly Twitter) post-2023 ownership change, advertiser interest typically declines. You can discover more insights about social media ad costs to better understand these market dynamics.
A million impressions might seem successful, but what do they mean for your business? Without context, big numbers are just noise. The key is interpreting impression data to reveal the story behind the statistics.
Don't view impressions in isolation; combine them with other KPIs for a clearer assessment.
Click-Through Rate (CTR): High impressions with low CTR suggest your ad isn't compelling enough, possibly due to weak copy, visuals, or targeting.
Conversion Rate: A strong CTR but low conversions may indicate issues with your landing page or offer, disrupting the customer journey.
Viewability: If only 30% of impressions are viewable, the impact is less than expected. Focus on viewability to ensure ads are seen.
Frequency, the average number of times a user views your ad, should be monitored. High frequency may lead to ad fatigue, causing your audience to lose interest or become irritated.
An impression is an opportunity, but too many opportunities with the same person can quickly turn into an annoyance. The goal is effective reach, not relentless repetition.
If a campaign’s performance dips while frequency creeps up, it’s a clear sign to refresh your creative or adjust your targeting. In-store media networks are especially good at managing this by rotating creatives based on real-time shopper data. To get this right, it's worth mastering multi-touch attribution models to understand the full picture.
Every metric should aim to enhance return on investment, with impressions and other data points revealing actionable insights. check out our resources on how to optimize your ROI. This process transforms impression data from a simple count into a powerful diagnostic tool.

Even experts can be misled by impression data, which may distort a campaign's success and result in poor decisions. Understanding these pitfalls is key to creating reliable performance reports.
This common mix-up involves impressions being the total times your ad was shown, while reach refers to the unique viewers. Overlooking this can be costly. If your ad gets 100,000 impressions but reaches only 10,000 people, each person viewed it about 10 times, indicating potential ad fatigue instead of broad market coverage.
Paying for an unseen impression is like hiding a billboard behind a wall. A served impression indicates the ad file was sent, while a viewable impression shows the ad appeared on the user’s screen.
If your viewability rate is low, you are wasting your budget. Prioritize platforms and placements that guarantee high viewability to ensure your message has a real opportunity to connect.
Not all impressions are from humans; bots can inflate numbers and deplete your budget. Although many ad platforms filter these, you should monitor for unusual activity. Be alert for traffic spikes or low engagement despite high impressions, indicating non-human traffic. With global ad spending up over 50% since 2019, ensuring data quality is crucial for making informed decisions.
A single page view can produce multiple impressions. For example, if a webpage has three ad units (banner, sidebar, footer), one page view results in three ad impressions. The page view is the container, and the impressions are the items within.
Frequency is how often one person views your ad. Some repetition helps brand recall, but excessive repetition causes ad fatigue, leading to audience disinterest. An increasing frequency with a dropping CTR indicates your ad has become ineffective.
An impression’s value isn't static. The first time someone sees your ad, it’s an introduction. The third time, it’s a reminder. By the tenth time? You might just be annoying a potential customer.
It's normal to encounter varying impression counts on platforms like Google Ads, Meta, and your analytics. This is typically due to:
Different Definitions: Each platform defines impressions slightly differently.
Viewability Standards: The criteria for a "viewable" impression vary.
Bot and Fraud Filtering: Platforms use unique algorithms to filter out invalid traffic, causing differences.
It depends. A "good" Cost Per Mille (CPM) varies by industry, platform, targeting, and seasonality. Instead of seeking a universal benchmark, compare your campaign's CPM to previous ones for a more practical measure of cost-efficiency.
Ready to move beyond counting impressions and start influencing purchases where it matters most? Intouch.com’s AI-driven platform delivers personalized ads to shoppers right at the point of purchase. Our dashboards make it simple to track real performance and see your ROI grow.
Find out more at https://www.intouch.com.