
Let’s be honest, in business, one question matters more than almost any other: “Was it worth it?” That’s precisely what Return on Investment, or ROI, is designed to answer. It’s the ultimate scorecard for any financial decision you make.
ROI shows the percentage of money made versus money spent, simplifying performance comparisons between different initiatives like an in-store media campaign or new shelving investment.

Forget the complicated financial jargon for a moment. Think of it like this: you spend $100 on ingredients to bake a cake. You sell the cake for $150. Your ROI isn't just the $50 profit; it’s the relationship between that profit and your initial cost.
ROI evaluates investment efficiency, guiding business success and future investment decisions. A high ROI indicates success, while a low or negative ROI suggests a need to reconsider your approach.
Calculating ROI is surprisingly straightforward. You don't need to be a math whiz to figure it out.
Here’s the formula that powers it all:

Let's break that down into its core components so it's crystal clear.
So, for every dollar you invested, you earned 67 cents back in profit. That’s a healthy return! , Understanding this key metric is essential for making informed, data-driven decisions in your retail business, providing a consistent method to assess effectiveness.
Calculating ROI involves more than just applying a formula; it requires analyzing all expenses and profits to gain an accurate understanding. The formula's simplicity belies the complexity of its components—Net Profit and Cost of Investment. Accurately determining these elements is crucial for transforming data into actionable business insights.
First up, let’s talk about the Cost of Investment. This is not just the price on the invoice. It’s the total, all-in cost required to get an asset or project off the ground and keep it running smoothly.
Think of it like this. You have to account for everything, including:
If you ignore these "hidden" expenses, you’ll end up with an artificially high ROI, giving you a false sense of victory.
Next, you need to pin down the Net Profit. This is the real financial gain that can be directly tied to your investment, after you subtract the total investment cost we just figured out.
Net Profit = Gross Profit (or Revenue Gain) - Cost of Investment
Consider a bakery that spends $5,000 on an online ordering system, resulting in $15,000 in new sales. The net profit is $10,000, after deducting the $5,000 cost.
This simple, three-step process is visualized perfectly in the infographic below.
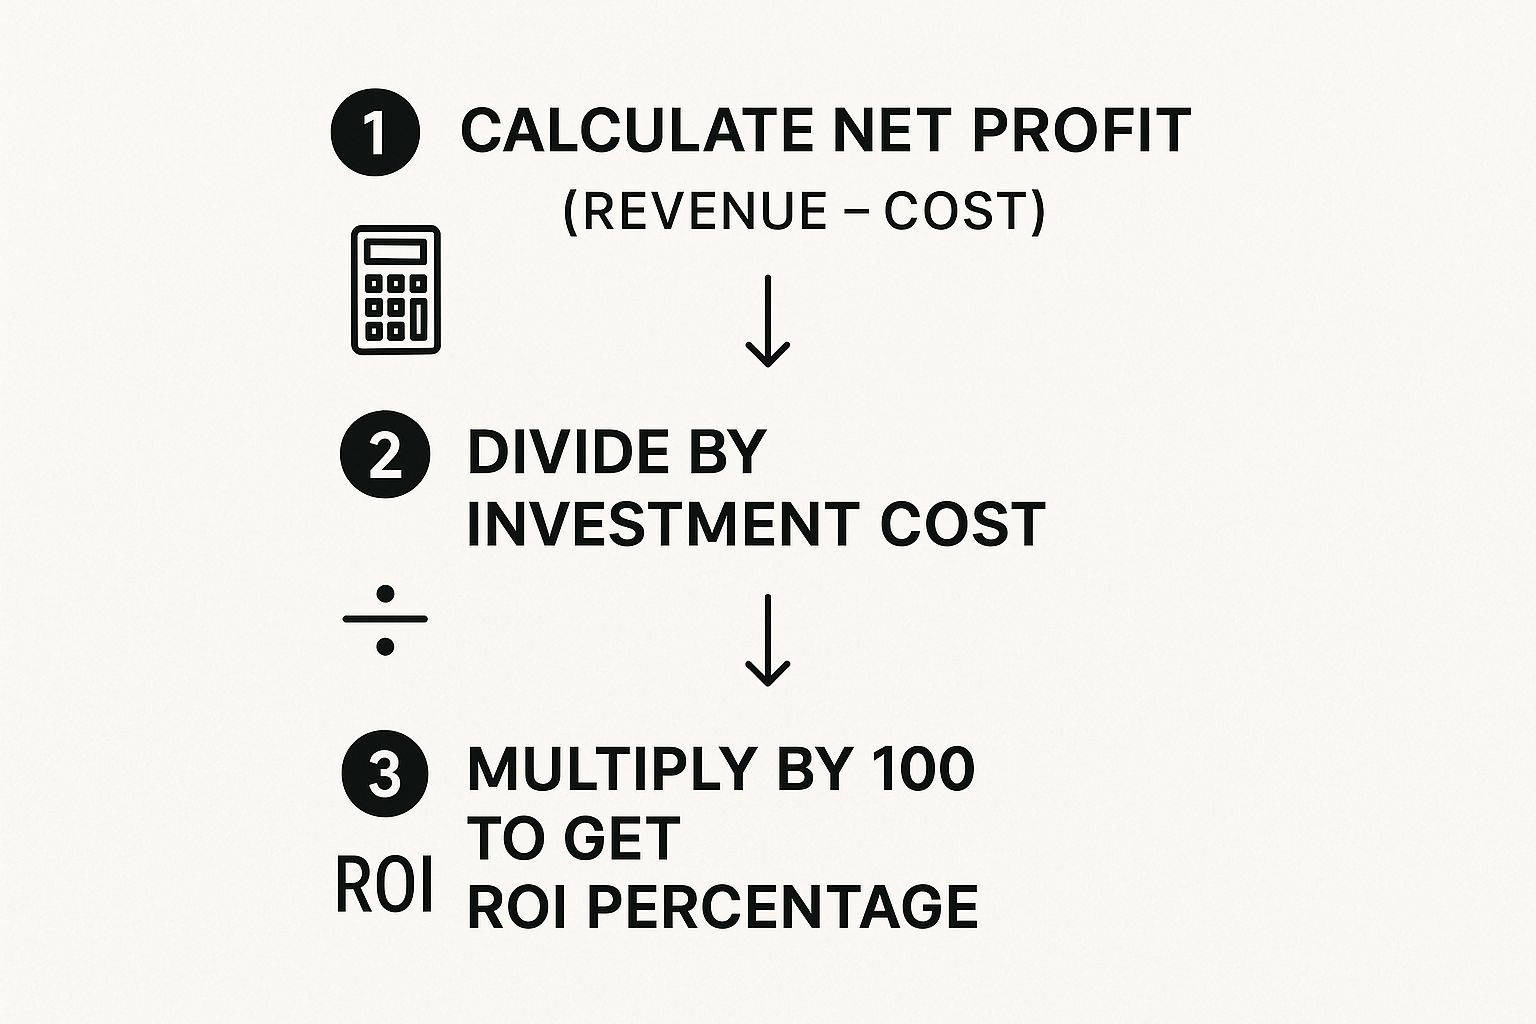
The net profit and investment cost yield a straightforward percentage. For our bakery, the ROI is ($10,000 / $5,000) x 100 = 200%, indicating a highly successful investment.
If you're looking for practical ways to track and boost your own returns, our guide to optimize your ROI is packed with actionable strategies.

Return on Investment is more than a figure on a spreadsheet; it serves as a strategic guide. It offers a standardized method to evaluate business opportunities, converting instincts into data-supported decisions.
Consider whether to invest in new software or hire another salesperson. Calculating potential ROI clarifies the costs and anticipated benefits, simplifying the decision-making process.
Businesses operate with limited resources: time, money, and people. ROI helps direct these towards impactful projects. By focusing on initiatives with the highest returns, you can create a growth roadmap and easily justify decisions to stakeholders.
Presenting a clear ROI forecast shows you've done your homework and builds confidence that company capital is being managed responsibly. It shifts the conversation from "I think this will work" to "Here's the value we expect to generate."
When you consistently track ROI, you start to see exactly what’s working and what isn’t. This lets you double down on your wins and cut your losses quickly. We've seen countless businesses find incredible value by focusing on this one core metric; you can see real-world examples in our client success stories.
ROI is a key metric used to compare investment performance over time. Historically, U.S. stocks have averaged an annual return of about 9.9% since 1928, serving as a useful benchmark.
While ROI is a cornerstone of good decision-making, it’s just one piece of the puzzle. It’s always smart to see how it stacks up against other powerful decision-making frameworks to get a complete picture.
A common question is, "What ROI should I aim for?" There's no single answer; it depends on your industry, risk tolerance, and investment context. For instance, a real estate investor may be satisfied with an 8-10% annual ROI, while a venture capitalist might seek 30% or higher for risky tech startups. This gets to the heart of a key principle: the higher the risk, the higher the expected return.
To determine a good ROI for your business, consider these key factors:
Additionally, market fluctuations, like the S&P 500's varied annual returns from -37% to +32%, highlight the importance of context. You can dig deeper into how market returns fluctuate over time to see just how much things can change.
At the end of the day, a good ROI is one that beats your initial forecasts, covers all your costs, and pushes your strategic business goals forward. It’s less about chasing a specific number and more about making smart, informed decisions.
ROI is helpful but incomplete. Solely relying on it might mean missing important opportunities or risks. It doesn't consider time; a 20% ROI in one year is better than over five years. Also, it overlooks non-financial benefits vital for long-term success. A project might have a modest ROI but offer value in other ways.
Some key investment gains aren't reflected in simple calculations. These intangible benefits are crucial for sustainable growth and should be considered with the numbers.
To get a complete picture, think of ROI as just one instrument on your dashboard. It works best when paired with other metrics like Net Present Value (NPV), which accounts for the time value of money, and Payback Period.
Inflation is another silent factor that can erode the real value of your returns. For instance, the U.S. stock market’s historical average return of 9.35% shrinks to about 6.94% once you factor in inflation. This shows just how critical it is to understand the bigger economic picture for an accurate analysis. You can dig deeper into how historical returns are affected by inflation to see this in action.
Even after understanding the formula, practical questions often arise. Let's address some common ones to ensure a solid grasp of ROI.
In marketing, Return on Investment (ROI) evaluates an investment's overall success by considering all costs to determine profitability. Conversely.
Return on Ad Spend (ROAS) focuses solely on the revenue generated per dollar spent on ads, assessing an ad campaign's effectiveness.
Key Takeaway: ROI gives you the full story of profitability. ROAS is a tactical tool that tells you how well your ad budget is performing on its own.
Thinking in terms of ROI helps you weigh the true costs and benefits of the choices that shape your life. For more answers to your business questions, feel free to explore our comprehensive FAQs section.
Ready to see a clear return on your in-store marketing? Intouch.com provides the AI-driven tools and analytics to measure and maximize the impact of every campaign. Discover how our platform can transform your retail space.